Share on Pinterest

The College Success Award recognizes and celebrates public high schools that excel in preparing students for postsecondary success. Over the years we have recognized:
Here we share the methodology used to determine the award-winning schools.
The objective of the College Success Award is to recognize and celebrate public high schools that are successfully preparing students to enroll and succeed in college. Award-winners are determined by a methodology that evaluates school-level data on college preparation, college enrollment, and college performance.
In 2021, GreatSchools introduced the College Success Award – Gold, an additional, elevated level of distinction to the College Success Award given to schools that have a multiyear track record of preparing students to enroll and succeed in college.
In 2021, GreatSchools collected sufficient data to calculate the College Success Award in 25 states: Alabama, Arkansas, Colorado, Connecticut, Georgia, Hawaii, Indiana, Kentucky, Louisiana, Massachusetts, Michigan, Minnesota, Mississippi, Missouri, Montana, Nebraska, New Jersey, North Carolina, North Dakota, Ohio, Oklahoma, Texas, Virginia, Vermont, and Washington.
Thirteen of the states where schools are eligible for a 2021 College Success Award provided additional data on measurements of college success for students from low-income households, which allowed GreatSchools to review the schools’ college success efforts with a greater lens on equity. The states providing this additional data for students eligible for free and reduced-price meals are Arkansas, Connecticut, Georgia, Indiana, Kentucky, Louisiana, Michigan, Mississippi, Nebraska, New Jersey, Texas, Virginia, and Washington.
Award winners are determined by calculating a school-level score and applying a threshold to delineate which schools receive an award and which do not. This school-level score is comprised of three components:
There are three principal limitations to the data:
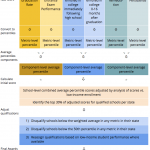
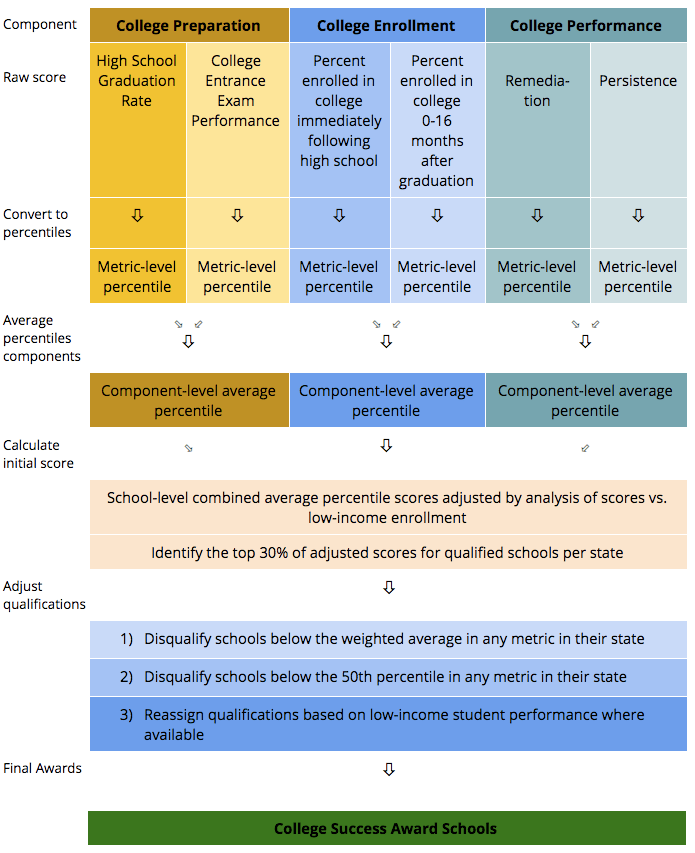
First, we standardize each of the inputs available for a particular school. To do this, we calculate the school’s position in the statewide distribution as a percentile for each metric.
Some states mandate that a specific college entrance exam is taken by all high school graduates. In these states, if data for multiple college entrance exams is obtained, only the data for the mandated exam is used. In states that do not require a specific exam to be taken, and where data for more than one college entrance exam is available, the data for the exam with the higher participation rate statewide is used. If participation rates are not available for either test then we include the data for both in the analysis.
Within each component, we calculate an average of the percentiles of the available metrics, resulting in a score for each of the three categories (College Preparation, College Enrollment, College Performance) for each school. This approach ensures that we give equal weight to the three types of college success metrics in the final school-level score. Eligibility for the award is based on schools having recent data in each of the components.
If a school is missing metrics in one category then that school is not included in the analysis and is not eligible for an award that year.
We calculate a single school-level score by averaging the three component scores and then identify the highest-scoring 30% of schools in each state. Our 2021 College Success Award methodology incorporates the same equity-focused approach that we introduced in 2019. To ensure that GreatSchools’ College Success Award recognizes success through different lenses, including equity, we identify schools that are “beating the odds” by better serving low-income students who might otherwise not be prepared for or attend college. We estimated how well a school would do by exploring the correlation between average school-level scores and student income levels and awarded schools credit for doing better than predicted. For schools outperforming expectations, we added their residuals to their initial school-level score to generate an adjusted school-level score.
After calculating school-level scores, we apply several rules to ensure that only schools that are performing well for all students move forward in the award process. First, schools that perform below the weighted average in a metric in their state will not receive the award. Second, schools that perform at or below the 50th percentile in a metric in their state are also disqualified. Third, in the 13 states where low-income student data is made available, schools in the top 25 percent for low-income students statewide (whether or not the school previously qualified) are automatically qualified; schools in the bottom 50 percent for low-income students statewide are disqualified. This step does not apply to schools in states where low-income student performance data are not available. Finally, schools that are performing below expected levels, i.e. those with negative residuals based on the correlation between average scores and low-income student enrollment, are disqualified regardless of their scores or previous qualification.
Schools with adjusted scores in the top 30 percent for their state that also meet the other criteria listed above and schools in which low-income students perform better than 75 percent of the low-income students at other schools in the state (where low-income data are made available) are the final College Success Award winners for 2021!
Find out how we determined the College Success Award winners prior to 2020.
The College Success Award – Gold honors schools with a strong track record of postsecondary success, as evidenced by the school winning two or more College Success Awards (with at least one of those wins being in 2020 or 2021).
In 2021, a total of 1,770 schools from the following 26 states satisfied the College Success Award – Gold criteria: Alabama, Arkansas, Connecticut, Colorado, Florida, Georgia, Hawaii, Idaho, Indiana, Kentucky, Louisiana, Massachusetts, Michigan, Minnesota, Mississippi, Missouri, Montana, Nebraska, New Jersey, North Carolina, North Dakota, Ohio, Oklahoma, Vermont, Texas, and Virginia.
Yes! Sign me up for updates relevant to my child's grade.